[Mimir 實戰] 打造本地監控系統
這篇文章中的目標是在本地端使用 docker-compose 打造監控系統,使用的 tech-stack 包含 :
- Node.js (Express.js) : 用於建立 api server
- PostgreSQL : 用於儲存資料
- Postgres Exporter : 用於輸出 PostgreSQL 的 metrics
- Alloy : 用於將不同的指標轉送到 mimir 中儲存
- Mimir : 用於儲存 metrics
- Grafana : 用於視覺化儀表板
- Curl : 用於模擬 request
Demo 的檔案結構如下 :
├─ config
│  ├─ alloy
│  │  └─ config.alloy
│  ├─ grafana
│  │  ├─ dashboards
│  │  │  ├─ nodejs.json
│  │  │  └─ postgres.json
│  │  └─ provisioning
│  │     ├─ dashboards
│  │     │  └─ dashboard.yaml
│  │     └─ datasources
│  │        └─ datasources.yaml
│  ├─ mimir
│  │  └─ mimir.yaml
│  └─ postgres
│     └─ init.sql
├─ docker-compose.yaml
├─ Dockerfile
├─ docs
│  ├─ image-1.png
│  └─ image.png
├─ index.mjs
├─ package-lock.json
├─ package.json
└─ README.md
API Setup
首先需要建立一些簡單的 api,這裡我使用 Express.js 這個框架,並用 prom-client 來記錄指標。
npm i express prom-client pg
接著在 index.js 中建立一些簡單的 api,並加上一個 middleware 來記錄指標,總共有四種不同的指標,傳送的 request 數量、request 的時間、request 的大小、response 的大小。
import express from 'express';
import promClient from 'prom-client';
import pg from 'pg';

const app = express();
app.use(express.json());

const pool = new pg.Pool({
  host: 'postgres',
  port: 5432,
  user: 'postgres',
  password: 'postgres',
  database: 'postgres'
});

const register = new promClient.Registry();
register.setContentType(promClient.Registry.OPENMETRICS_CONTENT_TYPE);

promClient.collectDefaultMetrics({ register });

const httpRequestCounter = new promClient.Counter({
  name: 'http_requests_total',
  help: 'Total number of HTTP requests',
  labelNames: ['method', 'route', 'status']
});
register.registerMetric(httpRequestCounter);

const httpRequestDurationHistogram = new promClient.Histogram({
  name: 'http_request_duration_seconds',
  help: 'Duration of HTTP requests in seconds',
  labelNames: ['method', 'route', 'status'],
  buckets: [0.01, 0.02, 0.03, 0.05, 0.1, 0.2, 0.3, 0.4, 0.5, 0.6, 0.7, 0.8, 0.9, 1, 2, 3, 4, 5, 10]
});
register.registerMetric(httpRequestDurationHistogram);

const httpRequestLengthHistogram = new promClient.Histogram({
  name: 'http_request_length_bytes',
  help: 'Length of HTTP requests in bytes',
  labelNames: ['method', 'route'],
  buckets: [100, 200, 300, 400, 500, 600, 700, 800, 900, 1000]
});
register.registerMetric(httpRequestLengthHistogram);

const httpResponseLengthHistogram = new promClient.Histogram({
  name: 'http_response_length_bytes',
  help: 'Length of HTTP responses in bytes',
  labelNames: ['method', 'route'],
  buckets: [100, 200, 300, 400, 500, 600, 700, 800, 900, 1000]
});
register.registerMetric(httpResponseLengthHistogram);

app.use((req, res, next) => {
  const start = Date.now();

  res.on('finish', () => {
    httpRequestCounter.labels(req.method, req.route.path, res.statusCode).inc();
    httpRequestDurationHistogram
      .labels(req.method, req.route.path, res.statusCode)
      .observe(Date.now() - start);
    httpRequestLengthHistogram.labels(req.method, req.route.path).observe(req.socket.bytesRead);
    httpResponseLengthHistogram.labels(req.method, req.route.path).observe(req.socket.bytesWritten);
  });
  next();
});

app.get('/metrics', async (req, res) => {
  res.set('Content-Type', register.contentType);
  res.end(await register.metrics());
});

app.get('/api/book/:bookId', async (req, res) => {
  try {
    const result = await pool.query('SELECT id, title FROM books WHERE id = $1', [
      req.params.bookId
    ]);
    if (result.rowCount === 0) {
      return res.status(404).send('Book not found');
    }
    res.status(200).send(result.rows[0]);
  } catch (error) {
    console.error(error);
    res.status(500).send('Internal server error');
  }
});

app.post('/api/book', async (req, res) => {
  try {
    const { title } = req.body;
    if (!title) {
      return res.status(400).send('Title is required');
    }
    await pool.query('INSERT INTO books (title) VALUES ($1)', [title]);
    res.status(201).send();
  } catch (error) {
    console.error(error);
    res.status(500).send('Internal server error');
  }
});

app.delete('/api/book/:bookId', async (req, res) => {
  try {
    await pool.query('DELETE FROM books WHERE id = $1', [req.params.bookId]);
    res.status(204).send();
  } catch (error) {
    console.error(error);
    res.status(500).send('Internal server error');
  }
});

app.listen(8000, async () => {
  try {
    await pool.connect();
    await pool.query(`
    CREATE TABLE IF NOT EXISTS books (
        id SERIAL PRIMARY KEY,
        title TEXT NOT NULL
        )
    `);
  } catch (error) {
    console.error(error);
    process.exit(1);
  }
  console.log('Server is running on http://localhost:8000');
});
並使用簡單的 Dockerfile 來打包我們的 server。
FROM node:20-alpine3.18

WORKDIR /app

COPY package*.json ./
RUN npm ci --production
COPY . .

EXPOSE 8000

CMD ["node", "index.mjs"]
Docker Compose
接下來設定 docker-compose 以及各個服務的 config file :
docker compose up -d
name: mimir-demo

services:
  alloy:
    container_name: alloy
    image: grafana/alloy:v1.7.1
    restart: always
    command: ['run', '--server.http.listen-addr=0.0.0.0:12345', '/etc/alloy/config.alloy']
    healthcheck:
      test:
        [
          'CMD',
          '/bin/bash',
          '-c',
          "echo -e 'GET /-/ready HTTP/1.1\\nHost: localhost\\nConnection: close\\n\\n' > /dev/tcp/localhost/12345"
        ]
      interval: 5s
      timeout: 5s
      retries: 10
      start_period: 5s
    volumes:
      - ./config/alloy/config.alloy:/etc/alloy/config.alloy
    ports:
      - '12345:12345'
    depends_on:
      postgres:
        condition: service_healthy
        restart: true

  mimir:
    container_name: mimir
    image: grafana/mimir:2.15.0
    restart: always
    command: ['-ingester.native-histograms-ingestion-enabled=true', '-config.file=/etc/mimir.yaml']
    ports:
      - '9009:9009'
    volumes:
      - './config/mimir/mimir.yaml:/etc/mimir.yaml'

  grafana:
    container_name: grafana
    image: grafana/grafana:11.5.1
    restart: always
    environment:
      - GF_AUTH_ANONYMOUS_ENABLED=true
      - GF_AUTH_ANONYMOUS_ORG_ROLE=Admin
      - GF_AUTH_DISABLE_LOGIN_FORM=true
    healthcheck:
      test: ['CMD', 'curl', '-f', 'http://localhost:3000/api/health']
      interval: 5s
      timeout: 5s
      retries: 5
      start_period: 5s
    volumes:
      - ./config/grafana/provisioning:/etc/grafana/provisioning
      - ./config/grafana/dashboards:/var/lib/grafana/dashboards
    ports:
      - '3000:3000'

  postgres:
    container_name: postgres
    image: postgres:16.8
    restart: always
    command:
      [
        'postgres',
        '-c',
        'shared_preload_libraries=pg_stat_statements',
        '-c',
        'pg_stat_statements.track=all'
      ]
    environment:
      POSTGRES_USER: postgres
      POSTGRES_PASSWORD: postgres
      POSTGRES_DB: postgres
    healthcheck:
      test: ['CMD', 'pg_isready', '-U', 'postgres']
      interval: 5s
      timeout: 5s
      retries: 10
      start_period: 5s
    volumes:
      - ./config/postgres/init.sql:/docker-entrypoint-initdb.d/init.sql
    ports:
      - '5432:5432'

  postgres-exporter:
    container_name: postgres-exporter
    image: prometheuscommunity/postgres-exporter:v0.17.1
    restart: always
    environment:
      DATA_SOURCE_NAME: 'postgresql://postgres:postgres@postgres:5432/postgres?sslmode=disable'
    healthcheck:
      test: ['CMD', 'pg_isready', '-U', 'postgres']
      interval: 5s
      timeout: 5s
      retries: 10
      start_period: 5s
    ports:
      - '9187:9187'

  server:
    container_name: server
    build:
      dockerfile: Dockerfile
    restart: always
    ports:
      - '8000:8000'
    depends_on:
      alloy:
        condition: service_healthy
        restart: true
      postgres:
        condition: service_healthy
        restart: true

  request:
    container_name: request
    image: curlimages/curl:8.12.1
    restart: always
    command: |
      sh -c 'while true; do
        method=$$(echo "GET POST PUT DELETE" | tr " " "\n" | shuf -n1)
        bookId=$$(shuf -i 1-100 -n1)
        case $$method in
          GET)
            ep=$$(echo "/api/book/$$bookId" | tr " " "\n" | shuf -n1)
            curl -s -X GET http://server:8000$$ep
            ;;
          POST)
            curl -s -X POST -H "Content-Type: application/json" http://server:8000/api/book -d "{\"title\": \"Book $$bookId\"}"
            ;;
          DELETE)
            curl -s -X DELETE http://server:8000/api/book/$$bookId
            ;;
        esac
        sleep 0.05
      done'
Alloy
可以在 localhost:12345 中查看 alloy 的流程圖 :
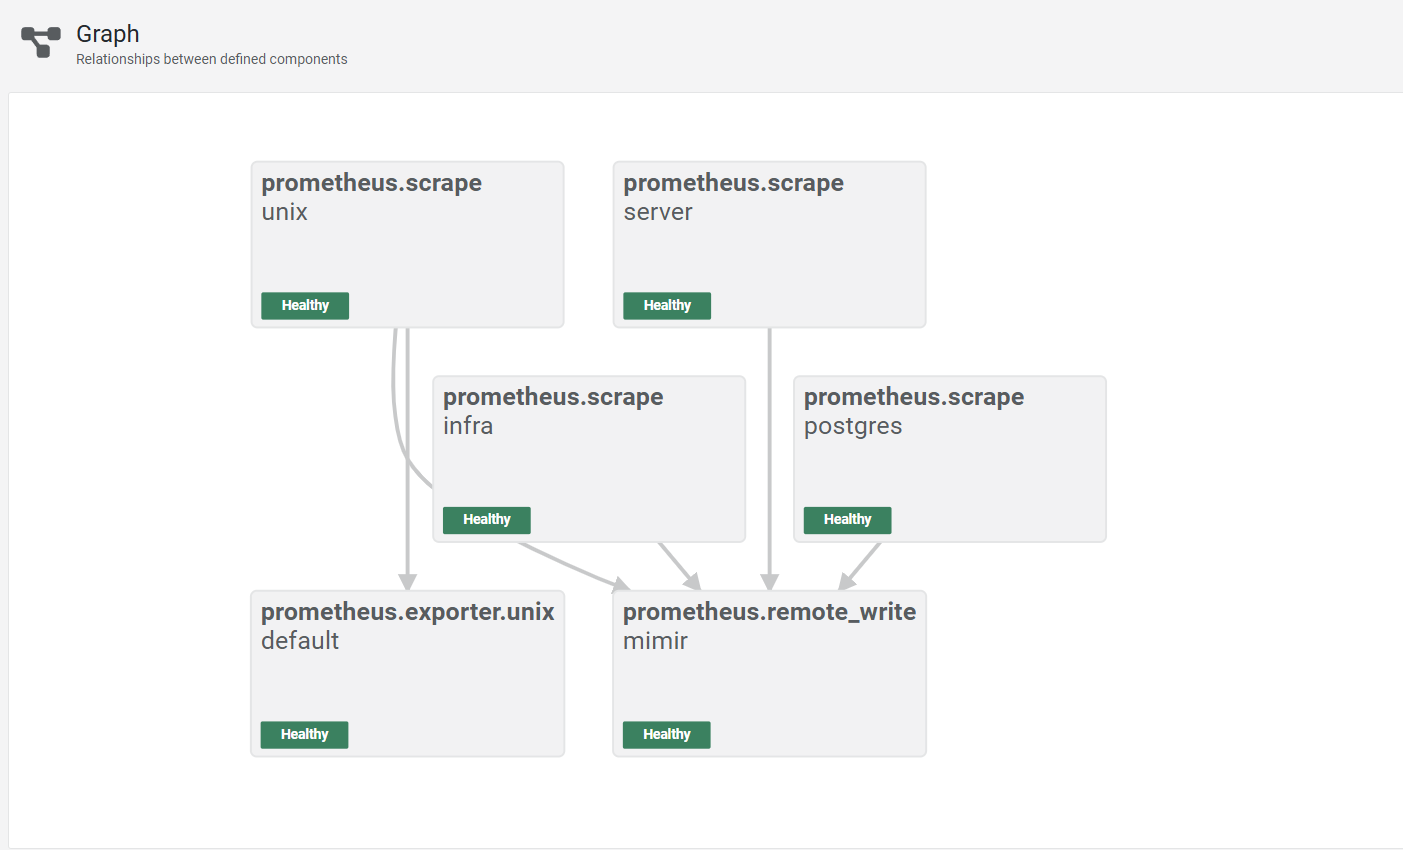
config file 的設定包含了 infra (例如 grafana、mimir、alloy 本身) 的 metrics (prometheus.scrape "infra")、
app 的 metrics (prometheus.scrape) 以及本機 (prometheus.exporter.unix ) 和 postgres 的 metrics (prometheus.scrape "postgres")。
需要注意的是,我原本打算使用 prometheus.exporter.postgres 來輸出 postgres 的 metrics,但是它似乎無法蒐集到跟 cpu 以及 memory 相關的資料,因此後來改成搭配 postgres-exporter 來輸出,如果有需要可以參考註解中的設定。
prometheus.scrape "infra" {
    targets = [
        {"__address__" = "mimir:9009", service = "mimir"},
        {"__address__" = "grafana:3000", service = "grafana"},
        {"__address__" = "localhost:12345", service = "alloy"},
    ]

    scrape_interval = "15s"

    forward_to = [prometheus.remote_write.mimir.receiver]

    job_name = "infra"
}

prometheus.scrape "server" {
    targets = [
        {"__address__" = "server:8000", service = "server"},
    ]

    scrape_interval = "2s"
    scrape_timeout = "2s"

    forward_to = [prometheus.remote_write.mimir.receiver]

    job_name = "server"
}

prometheus.exporter.unix "default" {
}

// This component scrapes the Unix exporter metrics generated above.
prometheus.scrape "unix" {
    targets = prometheus.exporter.unix.default.targets

    forward_to = [prometheus.remote_write.mimir.receiver]

    job_name = "node_exporter"
}

// // This component scrapes the Postgres exporter metrics.
// prometheus.exporter.postgres "default" {
//     data_source_names = ["postgres://postgres:postgres@postgres:5432/postgres?sslmode=disable"]
//     enabled_collectors = [
//         "database",
//         "database_wraparound",
//         "locks",
//         "long_running_transactions",
//         "postmaster",
//         "process_idle",
//         "replication",
//         "replication_slot",
//         "stat_activity_autovacuum",
//         "stat_bgwriter",
//         "stat_database",
//         "stat_statements",
//         "stat_user_tables",
//         "stat_wal_receiver",
//         "statio_user_indexes",
//         "statio_user_tables",
//         "wal",
//     ]
// }

// prometheus.scrape "postgres" {
//     targets = prometheus.exporter.postgres.default.targets

//     forward_to = [prometheus.remote_write.mimir.receiver]

//     job_name = "postgres"
// }

prometheus.scrape "postgres" {
    targets = [
        {"__address__" = "postgres-exporter:9187", service = "postgres"},
    ]

    forward_to = [prometheus.remote_write.mimir.receiver]

    job_name = "postgres"
}


prometheus.remote_write "mimir" {
    endpoint {
        url = "http://mimir:9009/api/v1/push"

        basic_auth {
            username = ""
            password = ""
        }
    }
}
Mimir
Mimir 的設定基本上也是本地的設定,並且使用 local filesystem 來儲存資料,實際上在 production 中應該要使用其他的儲存方式。
# For more information on this configuration, see the complete reference guide at
# https://grafana.com/docs/mimir/latest/references/configuration-parameters/

# Disable multi-tenancy and restrict to single tenant.
multitenancy_enabled: false

# The block storage configuration determines where the metrics TSDB data is stored.
blocks_storage:
  # Use the local filesystem for block storage.
  # Note: It is highly recommended not to use local filesystem for production data.
  backend: filesystem
  # Directory in which to store synchronised TSDB index headers.
  bucket_store:
    sync_dir: /tmp/mimir/tsdb-sync
  # Directory in which to store configuration for object storage.
  filesystem:
    dir: /tmp/mimir/data/tsdb
  # Direction in which to store TSDB WAL data.
  tsdb:
    dir: /tmp/mimir/tsdb

# The compactor block configures the compactor responsible for compacting TSDB blocks.
compactor:
  # Directory to temporarily store blocks underdoing compaction.
  data_dir: /tmp/mimir/compactor
  # The sharding ring type used to share the hashed ring for the compactor.
  sharding_ring:
    # Use memberlist backend store (the default).
    kvstore:
      store: memberlist

# The distributor receives incoming metrics data for the system.
distributor:
  # The ring to share hash ring data across instances.
  ring:
    # The address advertised in the ring. Localhost.
    instance_addr: 127.0.0.1
    # Use memberlist backend store (the default).
    kvstore:
      store: memberlist

# The ingester receives data from the distributor and processes it into indices and blocks.
ingester:
  # The ring to share hash ring data across instances.
  ring:
    # The address advertised in the ring. Localhost.
    instance_addr: 127.0.0.1
    # Use memberlist backend store (the default).
    kvstore:
      store: memberlist
    # Only run one instance of the ingesters.
    # Note: It is highly recommended to run more than one ingester in production, the default is an RF of 3.
    replication_factor: 1

# The ruler storage block configures ruler storage settings.
ruler_storage:
  # Use the local filesystem for block storage.
  # Note: It is highly recommended not to use local filesystem for production data.
  backend: filesystem
  filesystem:
    # The directory in which to store rules.
    dir: /tmp/mimir/rules

# The server block configures the Mimir server.
server:
  # Listen on port 9009 for all incoming requests.
  http_listen_port: 9009
  # Log messages at info level.
  log_level: info

# The store gateway block configures gateway storage.
store_gateway:
  # Configuration for the hash ring.
  sharding_ring:
    # Only run a single instance. In production setups, the replication factor must
    # be set on the querier and ruler as well.
    replication_factor: 1

# Global limits configuration.
limits:
  # A maximum of 100000 exemplars in memory at any one time.
  # This setting enables exemplar processing and storage.
  max_global_exemplars_per_user: 100000
  ingestion_rate: 30000
Grafana
可以在 docker-compose 中設定好 provisioning,並且將 dashboard 與 datasource 的設定檔放在對應的資料夾中 :
apiVersion: 1

datasources:
  - name: Mimir
    type: prometheus
    access: proxy
    uid: mimir
    url: http://mimir:9009/prometheus
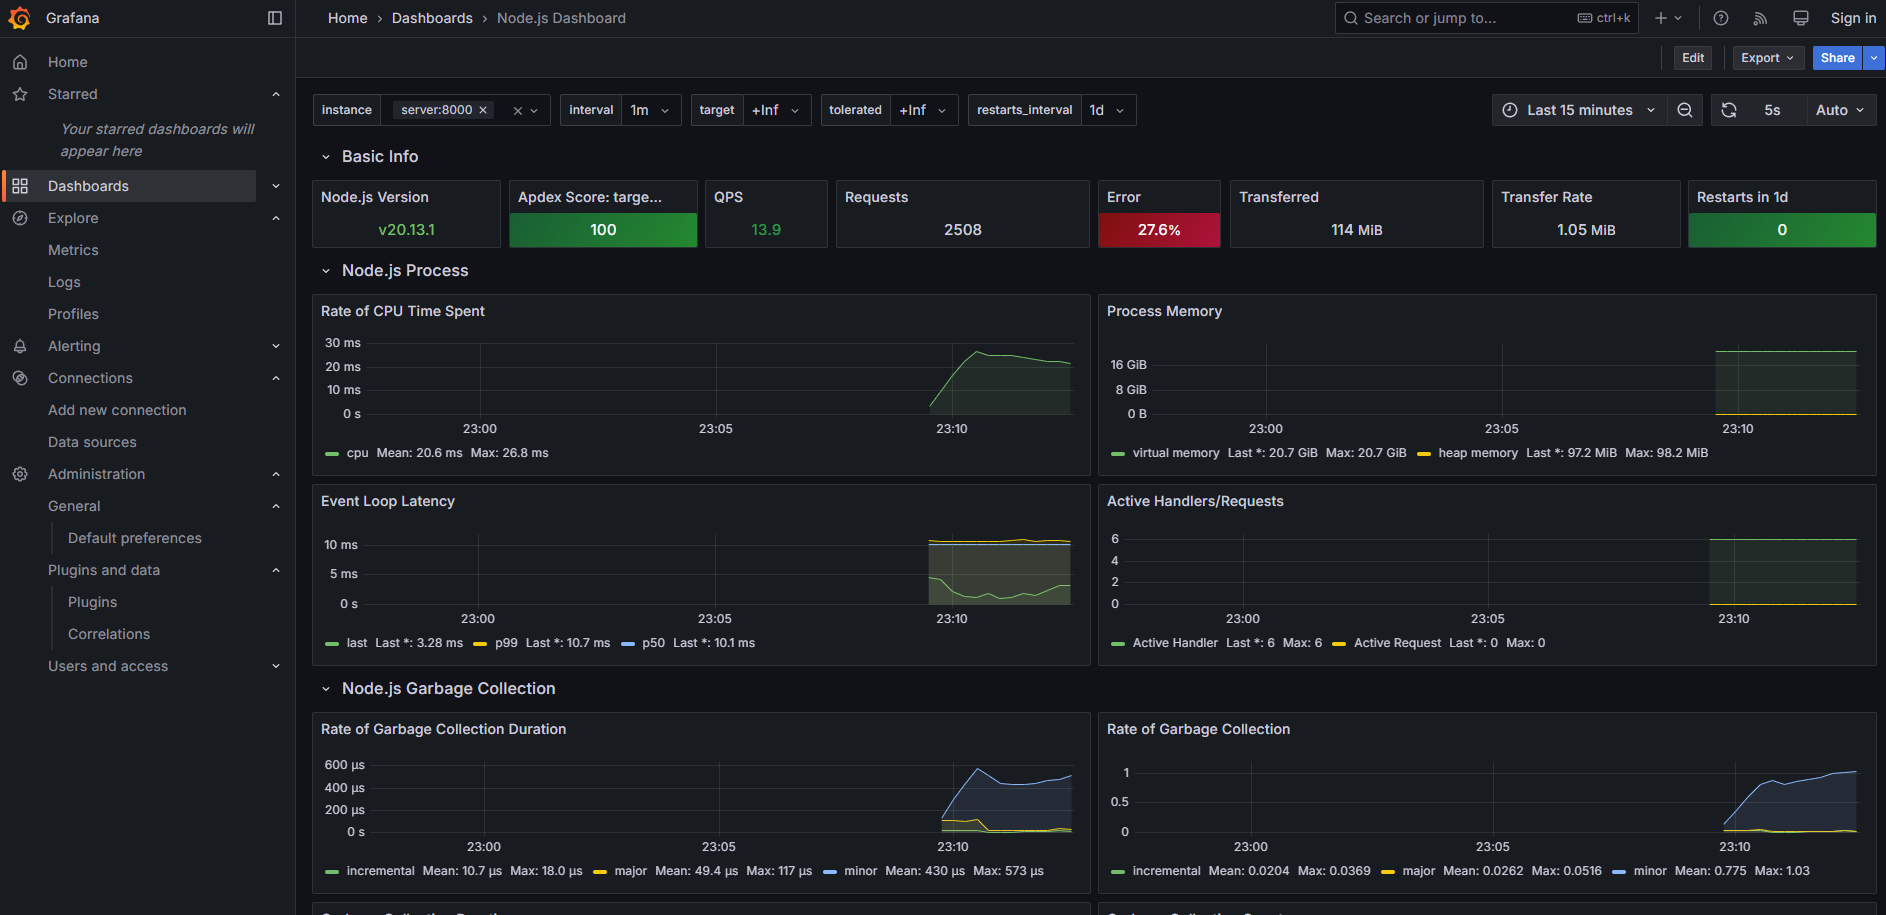
dashboard 則可以直接參考上面的 GitHub Repo 中的 json 檔案,我使用的是以下兩個 template :
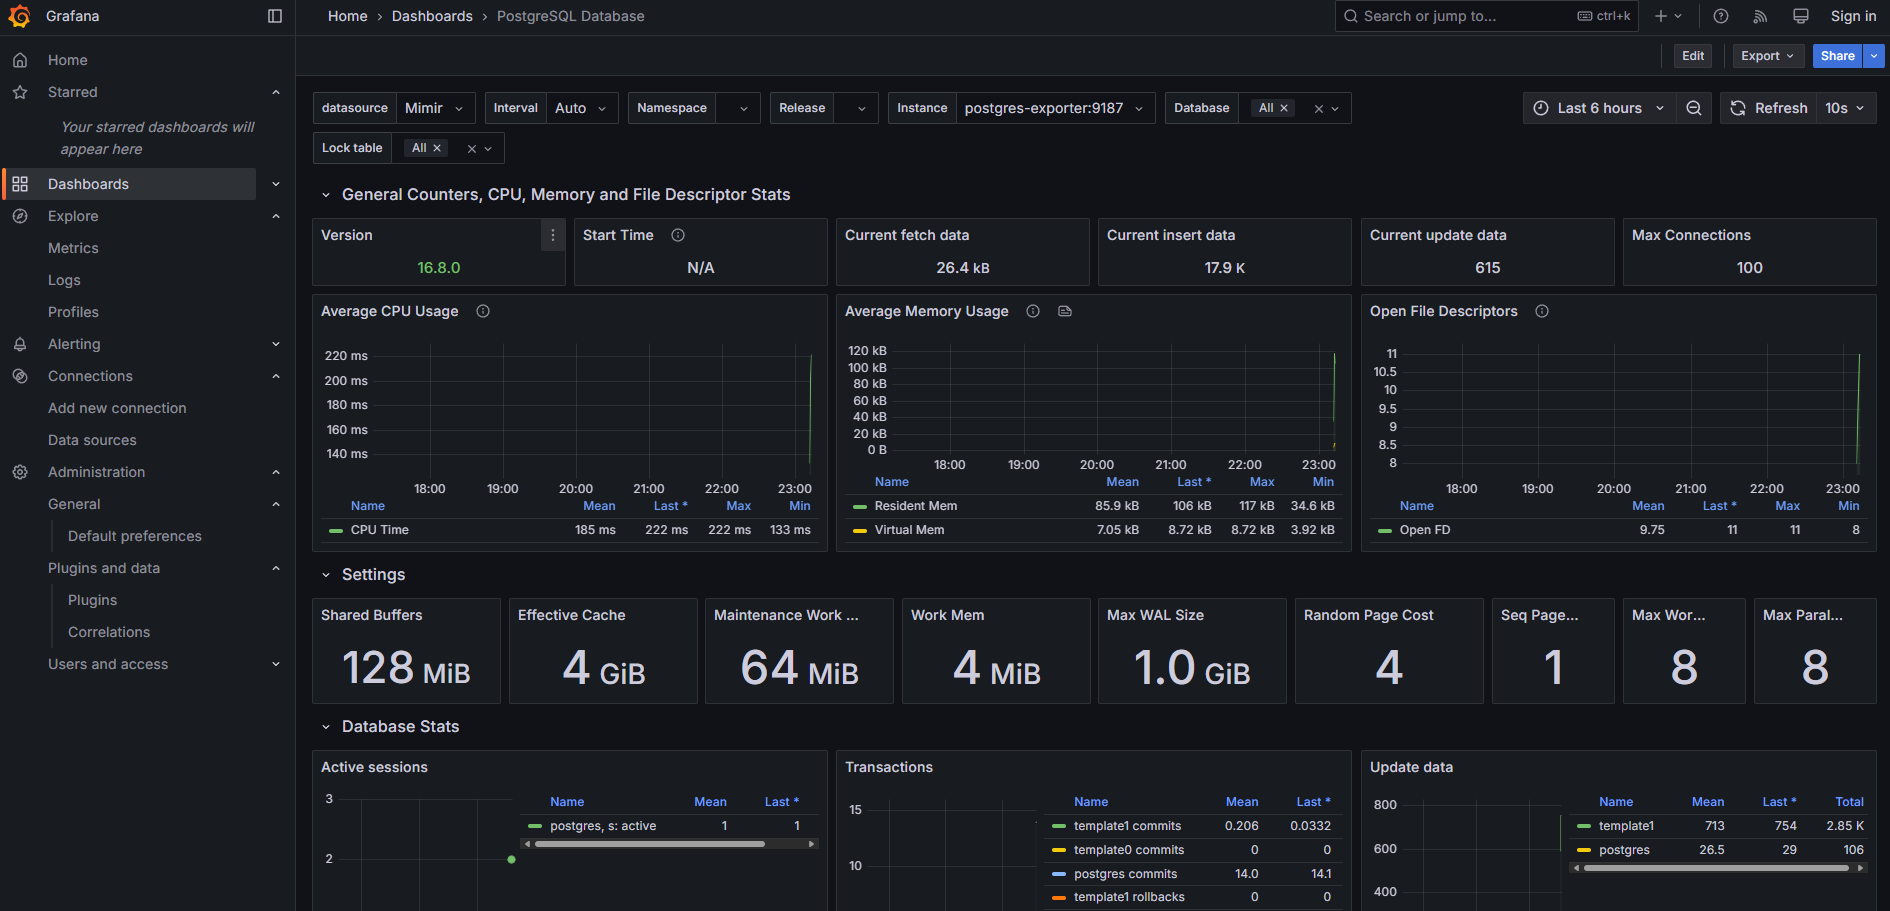
PostgreSQL
在 postgres 中我們需要啟用 pg_stat_statements 這個 extension 來記錄 query 的 performance,需要修改 config 並使用 init.sql 來初始化。
CREATE EXTENSION IF NOT EXISTS pg_stat_statements;
Server
剛剛建立的 api server,會開啟一個 /metrics 的 endpoint 來輸出 metrics,可以在 localhost:8000/metrics 中查看。
Request
使用 curl 指令隨機對 server 的其中一個 api 發送 request。