[Loki 實戰] 打造本地日誌蒐集系統
這篇文章中的目標是在本地端使用 docker-compose 打造日誌蒐集系統,所使用的 tech stack 如下 :
- Node.js (Express.js) : 用於建立 api server
- PostgreSQL : 用於儲存資料
- Alloy : 用於將 log 處理後轉送到 loki
- Loki : 用於儲存 log
- Grafana : 用於視覺化儀表板
- Curl : 用於模擬 request
Demo 的檔案結構如下 :
├─ config
│  ├─ alloy
│  │  └─ config.alloy
│  ├─ grafana
│  │  ├─ dashboards
│  │  └─ provisioning
│  │     └─ datasources
│  │        └─ datasources.yaml
│  └─ loki
│     └─ loki.config.yaml
├─ docker-compose.yaml
├─ Dockerfile
├─ index.mjs
├─ logger.mjs
├─ package-lock.json
├─ package.json
└─ README.md
API Setup
首先需要建立一些簡單的 api,這裡我使用 Express.js 這個框架,並且使用 axios 來將 log 傳送到 alloy。
npm i express axios pg
接著在 index.js 中建立一些簡單的 api,並加上一個 middleware 來記錄 log :
import express from 'express';
import pg from 'pg';
import logger from './logger.mjs';

const app = express();

app.use(express.json());

const pool = new pg.Pool({
  host: 'postgres',
  port: 5432,
  user: 'postgres',
  password: 'postgres',
  database: 'postgres'
});

app.use((req, res, next) => {
  res.on('finish', () => {
    if (res.statusCode >= 400) {
      logger.error({
        message: `msg="Received response" method=${req.method} path=${req.route.path} ip=${req.ip} status=${res.statusCode} url=${req.originalUrl}`
      });
    } else {
      logger.info({
        message: `msg="Received response" method=${req.method} path=${req.route.path} ip=${req.ip} status=${res.statusCode} url=${req.originalUrl}`
      });
    }
  });
  next();
});

app.get('/api', (req, res) => {
  if (Math.random() < 0.1) {
    return res.status(500).send('Internal server error');
  }
  res.status(200).send('Hello, world!');
});

app.get('/api/book/:bookId', async (req, res) => {
  if (Math.random() < 0.1) {
    return res.status(404).send('Book not found');
  }

  try {
    const result = await pool.query('SELECT id, title FROM books WHERE id = $1', [
      req.params.bookId
    ]);
    if (result.rowCount === 0) {
      return res.status(404).send('Book not found');
    }
    res.status(200).send(result.rows[0]);
  } catch (error) {
    console.error(error);
    res.status(500).send('Internal server error');
  }
});

app.post('/api/book', async (req, res) => {
  if (Math.random() < 0.1) {
    return res.status(500).send('Internal server error');
  }

  try {
    const { title } = req.body;
    if (!title) {
      return res.status(400).send('Title is required');
    }
    await pool.query('INSERT INTO books (title) VALUES ($1)', [title]);
    res.status(201).send();
  } catch (error) {
    console.error(error);
    res.status(500).send('Internal server error');
  }
});

app.delete('/api/book/:bookId', async (req, res) => {
  if (Math.random() < 0.1) {
    return res.status(500).send('Internal server error');
  }

  try {
    await pool.query('DELETE FROM books WHERE id = $1', [req.params.bookId]);
    res.status(204).send();
  } catch (error) {
    console.error(error);
    res.status(500).send('Internal server error');
  }
});

app.listen(8000, async () => {
  try {
    await pool.connect();
    await pool.query(`
    CREATE TABLE IF NOT EXISTS books (
        id SERIAL PRIMARY KEY,
        title TEXT NOT NULL
        )
    `);
  } catch (error) {
    console.error(error);
    process.exit(1);
  }
  console.log('Server is running on http://localhost:8000');
});
接著建立一個 logger service 來處理 log,這裡使用 axios 來發送 log 到 alloy。
需要特別注意的是傳輸的格式必須符合 loki 的格式,可以參考 Loki Push API。
{
  "streams": [
    {
      "stream": {
        "label": "value"
      },
      "values": [
        ["<unix epoch in nanoseconds>", "<log line>", { "metadata": "value" }],
        ["<unix epoch in nanoseconds>", "<log line>", { "metadata": "value" }]
      ]
    }
  ]
}
呼叫的方式是 logger.<level>({ message, ...metadata })。
import axios from 'axios';

class LoggerService {
  async log(level, message, metadata) {
    metadata.pod = 'loki-123';

    const lokiLogEntry = {
      streams: [
        {
          stream: {
            level: level,
            service_name: 'loki-demo'
          },
          values: [[`${Date.now() * 1000000}`, message, metadata]]
        }
      ]
    };

    try {
      await axios.post(`http://alloy:3100/loki/api/v1/push`, lokiLogEntry);
      console.log(`[${level.toUpperCase()}] ${message}`);
    } catch (error) {
      console.error('Error logging to Loki: ', error);
    }
  }

  fatal(payload) {
    const { message, ...metadata } = payload;
    this.log('fatal', message, metadata);
  }

  error(payload) {
    const { message, ...metadata } = payload;
    this.log('error', message, metadata);
  }

  warn(payload) {
    const { message, ...metadata } = payload;
    this.log('warn', message, metadata);
  }

  info(payload) {
    const { message, ...metadata } = payload;
    this.log('info', message, metadata);
  }

  debug(payload) {
    const { message, ...metadata } = payload;
    this.log('debug', message, metadata);
  }
}

export default new LoggerService();
最後使用簡單的 Dockerfile 來包裝我們的 server :
FROM node:20-alpine3.18

WORKDIR /app

COPY package*.json ./
RUN npm ci --production
COPY . .

EXPOSE 8000

CMD ["node", "index.mjs"]
Docker Compose
接下來設定 docker-compose 以及各個服務的 config file :
docker compose up -d
name: loki-demo

services:
  alloy:
    container_name: alloy
    image: grafana/alloy:v1.7.1
    restart: always
    command: ['run', '--server.http.listen-addr=0.0.0.0:12345', '/etc/alloy/config.alloy']
    healthcheck:
      test:
        [
          'CMD',
          '/bin/bash',
          '-c',
          "echo -e 'GET /-/ready HTTP/1.1\\nHost: localhost\\nConnection: close\\n\\n' > /dev/tcp/localhost/12345"
        ]
      interval: 5s
      timeout: 5s
      retries: 10
      start_period: 5s
    volumes:
      - ./config/alloy/config.alloy:/etc/alloy/config.alloy
      - ./data/postgres/logs:/var/log/
    ports:
      - '12345:12345'

  loki:
    container_name: loki
    image: grafana/loki:3.4.2
    restart: always
    command: ['--pattern-ingester.enabled=true', '-config.file=/etc/loki/loki.config.yaml']
    healthcheck:
      test: wget --quiet --tries=1 --output-document=- http://localhost:3100/ready | grep -q -w ready || exit 1
      interval: 10s
      timeout: 5s
      retries: 10
      start_period: 20s
    volumes:
      - ./config/loki/loki.config.yaml:/etc/loki/loki.config.yaml
    ports:
      - '3100:3100'

  grafana:
    container_name: grafana
    image: grafana/grafana:11.5.1
    restart: always
    environment:
      - GF_INSTALL_PLUGINS=grafana-lokiexplore-app
      - GF_AUTH_ANONYMOUS_ENABLED=true
      - GF_AUTH_ANONYMOUS_ORG_ROLE=Admin
      - GF_AUTH_DISABLE_LOGIN_FORM=true
    healthcheck:
      test: ['CMD', 'curl', '-f', 'http://localhost:3000/api/health']
      interval: 5s
      timeout: 5s
      retries: 5
      start_period: 5s
    volumes:
      - ./config/grafana/provisioning:/etc/grafana/provisioning
      - ./config/grafana/dashboards:/var/lib/grafana/dashboards
    ports:
      - '3000:3000'

  postgres:
    container_name: postgres
    image: postgres:16.8
    restart: always
    command:
      [
        'postgres',
        '-c',
        'logging_collector=on',
        '-c',
        'log_destination=jsonlog',
        '-c',
        'log_directory=/logs',
        '-c',
        'log_filename=log-%M.log',
        '-c',
        'log_rotation_age=1min',
        '-c',
        'log_truncate_on_rotation=on',
        '-c',
        'log_statement=all'
      ]
    environment:
      POSTGRES_USER: postgres
      POSTGRES_PASSWORD: postgres
      POSTGRES_DB: postgres
    healthcheck:
      test: ['CMD', 'pg_isready', '-U', 'postgres']
      interval: 5s
      timeout: 5s
      retries: 10
      start_period: 5s
    volumes:
      - ./data/postgres/logs:/logs
    ports:
      - '5432:5432'

  server:
    container_name: server
    build:
      dockerfile: Dockerfile
    restart: always
    ports:
      - '8000:8000'
    depends_on:
      alloy:
        condition: service_healthy
        restart: true
      postgres:
        condition: service_healthy
        restart: true

  request:
    container_name: request
    image: curlimages/curl:8.12.1
    restart: always
    command: |
      sh -c 'while true; do
        method=$$(echo "GET POST PUT DELETE" | tr " " "\n" | shuf -n1)
        bookId=$$(shuf -i 1-100 -n1)
        case $$method in
          GET)
            ep=$$(echo "/api /api/book/$$bookId" | tr " " "\n" | shuf -n1)
            curl -s -X GET http://server:8000$$ep
            ;;
          POST)
            curl -s -X POST -H "Content-Type: application/json" http://server:8000/api/book -d "{\"title\": \"Book $$bookId\"}"
            ;;
          DELETE)
            curl -s -X DELETE http://server:8000/api/book/$$bookId
            ;;
        esac
        sleep 0.5
      done'
Alloy
可以在 localhost:12345 中查看 alloy 的流程圖 :
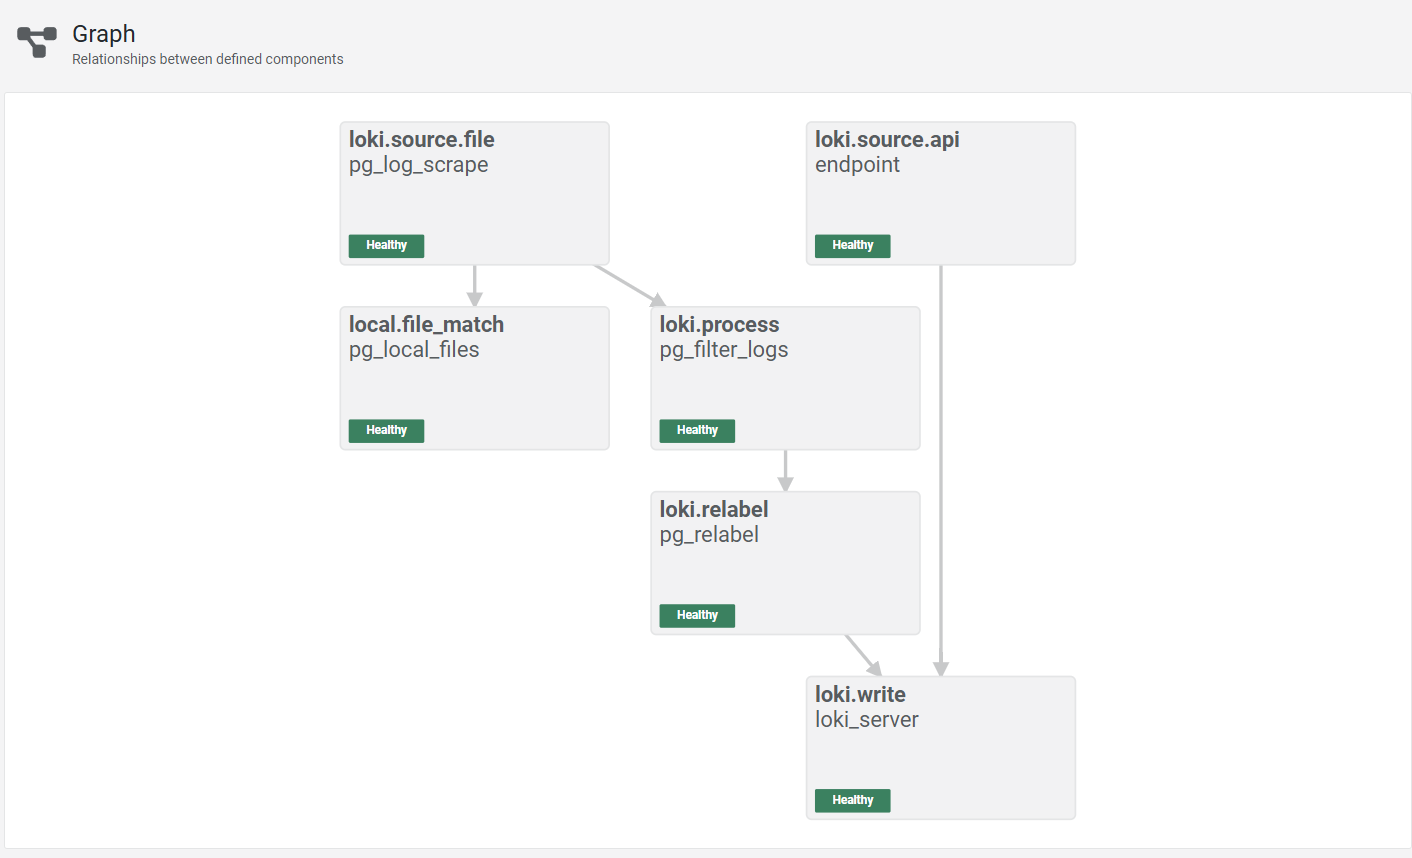
config file 的設定包含兩個部分,一個是處理應用程式傳過來的資料,另一個是處理 PostgreSQL 的 log。
應用程式的資料會直接在 server 中用 axios 傳到 alloy:3100 再送到 loki 儲存。
postgres 的 log 則是透過 local.file_match 來監聽 /var/log/*.json 這個目錄,接著處理好 timestamp 並加上兩個 label,最後加上 service_name 並送到 loki 儲存。
loki.source.api "endpoint" {
    http {
        listen_address = "0.0.0.0"
        listen_port = "3100"
    }

    forward_to = [loki.write.loki_server.receiver]
}

local.file_match "pg_local_files" {
    path_targets = [{"__path__" = "/var/log/*.json"}]

    sync_period = "5s"
}

loki.source.file "pg_log_scrape" {
    targets    = local.file_match.pg_local_files.targets

    tail_from_end = true

    forward_to = [loki.process.pg_filter_logs.receiver]
}

loki.process "pg_filter_logs" {
    stage.json {
        expressions = {ts = "timestamp", level = "error_severity", dbname = "dbname"}
    }

    stage.timestamp {
        source = "ts"
        format = "2006-01-02 15:04:05.000 MST"
    }

    stage.labels {
        values = {
            level = "level",
            dbname = "dbname",
        }
    }

    forward_to = [loki.relabel.pg_relabel.receiver]
}

loki.relabel "pg_relabel" {
    rule {
        regex  = "^filename$"
        action = "labeldrop"
    }

    rule {
        target_label = "service_name"
        replacement  = "postgres"
        action       = "replace"
    }

    forward_to = [loki.write.loki_server.receiver]
}

loki.write "loki_server" {
    endpoint {
        url = "http://loki:3100/loki/api/v1/push"

        basic_auth {
            username = ""
            password = ""
        }
    }
}
Loki
在 loki 的設定也是使用最基本的方式,監聽 3100 port,並且將 log 存放在 /tmp/loki 中,比較特別的地方是啟用了新版本才支援的 structured metadata :
# Disable multi-tenancy, ensuring a single tenant for all log streams.
auth_enabled: false

# Configuration block for the Loki server.
server:
  http_listen_port: 3100 # Listen on port 3100 for all incoming traffic.
  log_level: info # Set the log level to info.

# The limits configuration block allows default global and per-tenant limits to be set (which can be altered in an
# overrides block). In this case, volume usage is be enabled globally (as there is one tenant).
# This is used by the Logs Explorer app in Grafana.
limits_config:
  volume_enabled: true
  allow_structured_metadata: true
  discover_log_levels: true

# The common block is used to set options for all of the components that make up Loki. These can be overridden using
# the specific configuration blocks for each component.
common:
  instance_addr:
    127.0.0.1 # The address at which this Loki instance can be reached on the local hash ring.
    # Loki is running as a single binary, so it's the localhost address.
  path_prefix: /loki # Prefix for all HTTP endpoints.
  # Configuration of the underlying Loki storage system.
  storage:
    # Use the local filesystem. In a production environment, you'd use an object store like S3 or GCS.
    filesystem:
      chunks_directory: /loki/chunks # The FS directory to store the Loki chunks in.
      rules_directory: /loki/rules # The FS directory to store the Loki rules in.
  replication_factor:
    1 # The replication factor (RF) determines how many ingesters will store each chunk.
    # In this case, we have one ingester, so the RF is 1, but in a production system
    # you'd have multiple ingesters and set the RF to a higher value for resilience.
  # The ring configuration block is used to configure the hash ring that all components use to communicate with each other.
  ring:
    # Use an in-memory ring. In a production environment, you'd use a distributed ring like memberlist, Consul or etcd.
    kvstore:
      store: inmemory

# The schema_config block is used to configure the schema that Loki uses to store log data. Loki allows the use of
# multiple schemas based on specific time periods. This allows backwards compatibility on schema changes.
schema_config:
  # Only one config is specified here.
  configs:
    - from: 2020-10-24 # When the schema applies from.
      store: tsdb # Where the schema is stored, in this case using the TSDB store.
      object_store: filesystem # As configured in the common block above, the object store is the local filesystem.
      schema: v13 # Specify the schema version to use, in this case the latest version (v13).
      # The index configuration block is used to configure how indexing tables are created and stored. Index tables
      # are the directory that allows Loki to determine which chunks to read when querying for logs.
      index:
        prefix: index_ # Prefix for all index tables.
        period: 24h # The period for which each index table covers. In this case, 24 hours.

# The ruler configuration block to configure the ruler (for recording rules and alerts) in Loki.
# ruler:
#   alertmanager_url:
#     http://localhost:9093
#     # The URL of the Alertmanager to send alerts to. Again, this is a single
#     # binary instance running on the same host, so it's localhost.
# By default, Loki will send anonymous, but uniquely-identifiable usage and configuration
# analytics to Grafana Labs. These statistics are sent to https://stats.grafana.org/
#
# Statistics help us better understand how Loki is used, and they show us performance
# levels for most users. This helps us prioritize features and documentation.
# For more information on what's sent, look at
# https://github.com/grafana/loki/blob/main/pkg/usagestats/stats.go
# Refer to the buildReport method to see what goes into a report.
#
# If you would like to disable reporting, uncomment the following lines:
#analytics:
#  reporting_enabled: false
Grafana
在 docker-compose 中,安裝了一個跟 loki 有關的 plugin,並且設定了匿名登入以及資料來源。
apiVersion: 1

datasources:
  - name: Loki
    type: loki
    access: proxy
    uid: loki
    url: http://loki:3100
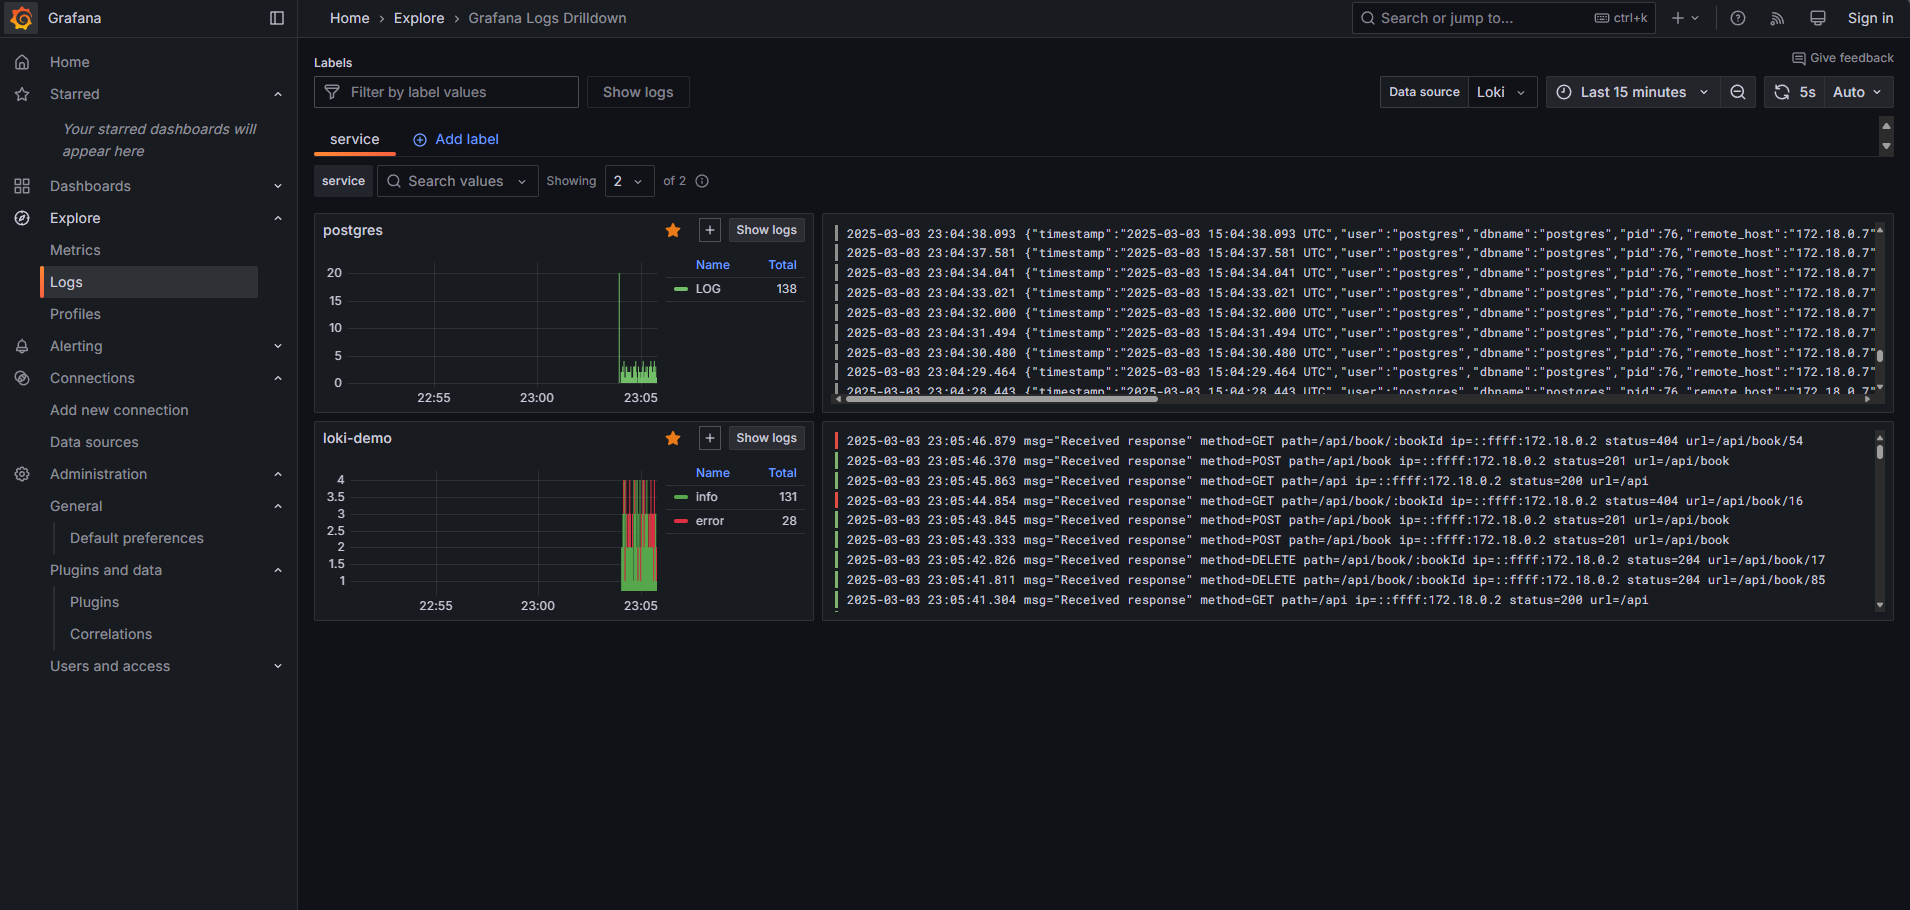
完成之後,可以打開 Grafana,並在左邊的 Explore 中選擇 Log,就能開始看到 log 了
PostgreSQL
在 docker-compose 中,我們啟用了 postgres 的 log,並且將 log 存放在 /logs 中,會以 json 的格式儲存來方便解析。
Server
剛剛建立的 api server,會接收請求並把 log 傳送到 alloy。
Request
使用 curl 指令隨機對 server 的其中一個 api 發送 request。